
How Permit Data Reveals Real Estate Investment Opportunity
Building permit data is a public-record signal that reveals where capital is flowing before prices move. Investors who understand how permit data reveals investment opportunity gain a 12–18 month look-ahead into market supply that most competitors never see. Platforms like Shovld, PermitStack, and Construction Near Me have made this data accessible and actionable at scale. Homes near infrastructure-led permit clusters see a 5%–12% value lift compared to broader city averages. That is not a coincidence. It is a predictable pattern you can track before it shows up in listing prices.
How permit data reveals investment opportunity before the market moves
Permit filings are filed months before a shovel touches the ground. That gap is your edge. A 12–18 month supply window sits between permit approval and completed construction, giving you time to acquire, reposition, or finance before the market reprices.
The mechanism is straightforward. When permit clusters appear in a submarket, they signal concentrated capital investment. That investment drives demand for labor, materials, and services, which raises land values and rents nearby. Up-zoning permits alone can increase land value by 20%–50% overnight. Investors who spot these clusters early are not guessing. They are reading a public ledger that most people ignore.
The permit types that matter most for investment analysis are:
New construction permits signal net new supply entering a submarket and forecast future rent competition or absorption pressure.
Major renovation permits (valued above $100,000) indicate owners reinvesting in aging stock, often a precursor to neighborhood repricing.
Up-zoning and change-of-use permits reveal repositioning plays. A warehouse converting to mixed-use residential is a textbook signal of equity creation ahead.
Utility upgrade permits are the most underused signal. They can precede rezoning announcements by six months, acting as an early insider indicator for major development.
Pro Tip: Track utility upgrade permits in submarkets you are watching. They are often filed quietly before formal rezoning, giving you a six-month head start on the broader market.
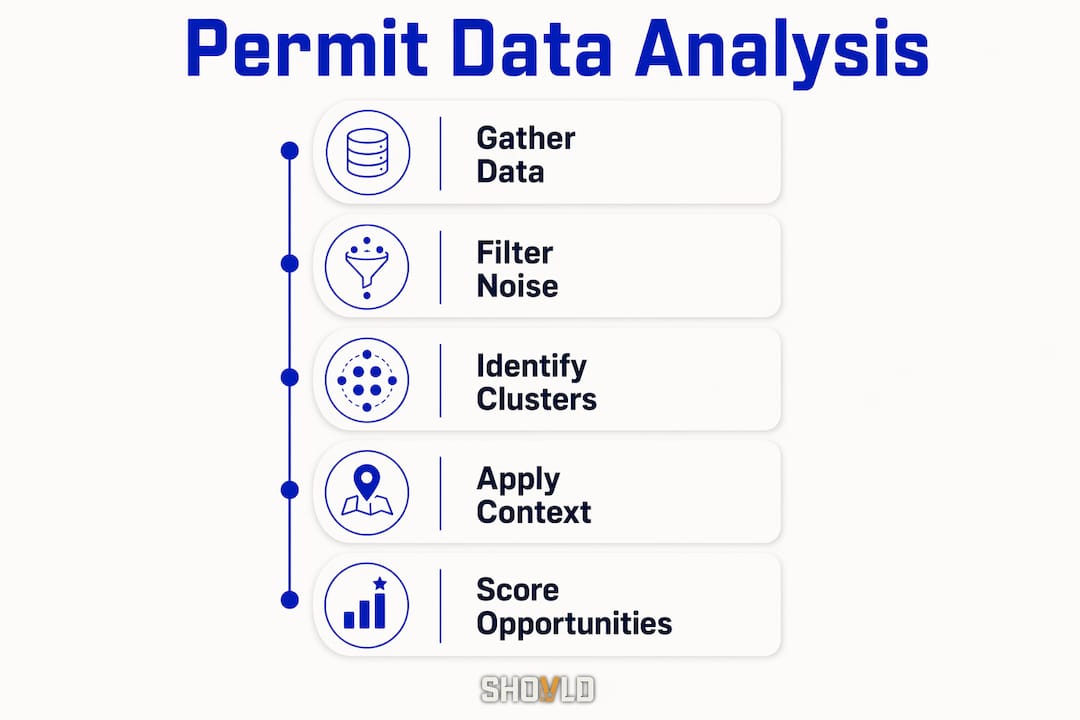
How to analyze permit data: techniques that actually work
Raw permit data is noisy. A city portal might return thousands of records per month, most of them minor residential repairs that tell you nothing about investment opportunity. Effective permit data analysis starts with filtering.

The standard practice is to set a value threshold of $100,000–$250,000 for commercial permits. This removes maintenance noise and surfaces capital projects that actually shift market dynamics. Below that threshold, you are mostly reading roof replacements and HVAC swaps.
Once you have filtered data, the analysis follows a logical sequence:
Apply geographic clustering. Map permits by address and look for density patterns. A cluster of five or more high-value permits within a half-mile radius over 90 days is a signal worth investigating.
Cross-reference owner and contractor information. Permit records include contractor names and property owner details. Repeat contractors working across multiple parcels in the same zone often indicate institutional capital moving into an area.
Use API aggregation platforms. Individual city portals are inconsistent and slow. PermitStack indexes over 39 million permits from 176 jurisdictions, normalizing records into searchable, filterable data. That scale is not achievable through manual portal searches.
Track permit velocity, not just volume. A submarket filing 30 permits per month is less interesting than one that jumped from 8 to 30 permits in 60 days. Velocity signals acceleration, and acceleration precedes price movement.
Layer in demographic and economic context. Permit data tells you where capital is going. Census data, employment trends, and income growth tell you whether the demand is real.
Pro Tip: When using an aggregation platform, set up saved searches by permit type, value threshold, and geography. Run them weekly. Consistency beats intensity in permit monitoring.
Analysis MethodBest ForLimitationCity portal manual searchSingle-market spot checksSlow, inconsistent formattingAPI aggregation (PermitStack, Shovld)Multi-market monitoring at scaleRequires setup and filtering disciplineGeographic heatmappingIdentifying cluster zones visuallyNeeds GIS tool or platform with mappingContractor cross-referencingSpotting institutional capital movementTime-intensive without automation
Should you combine permit data with other market signals?
Permit data used in isolation is a partial picture. The full picture requires context, and context comes from layering complementary signals.
Zoning trends are the most critical overlay. A permit cluster in a zone with active up-zoning proposals carries far more upside than the same cluster in a locked residential zone. Integrating zoning trends and NIMBY sentiment into your analysis gives you a risk-adjusted view of whether permitted projects will actually get built and at what scale.
Interest rates directly affect permit-driven opportunity timing. When financing costs rise, permitted projects slow down or stall. A surge in permit filings during a high-rate environment can signal developers with strong balance sheets moving while competitors sit out. That is a quality signal, not a warning.
Permit denials are as informative as approvals. Widespread permit denials in a submarket indicate tightening regulatory conditions that raise execution risk for any project you might pursue there. Tracking denial rates alongside approval rates gives you a regulatory health score for any target market.
“A Real Estate Risk Radar that scrapes permits, zoning, and NIMBY sentiment offers a competitive edge in underwriting and site selection.” — ScrapingAnt
Infrastructure pre-permits deserve special attention. Utility upgrades, road widening permits, and sewer capacity expansions are often filed by municipalities before any private development is announced. Tracking these signals lets you anticipate where private capital will follow. The timing advantage can reach six months ahead of public rezoning announcements.
Pro Tip: Build a simple scoring model. Assign points for permit cluster density, value threshold, zoning trajectory, and infrastructure pre-permits. Any submarket scoring above your threshold gets a deeper underwriting pass.
What investors can do today to act on permit signals
The gap between knowing permit data matters and actually using it is a process problem. Most investors acknowledge the value but never build a consistent monitoring routine. The ones who do gain a durable edge.
Here is what a practical permit monitoring setup looks like:
Set up weekly alerts in your target markets using a platform like Shovld or PermitStack. Filter for commercial and multifamily permits above $100,000. Review every Monday before your week starts.
Prioritize multifamily permits near your existing assets. A surge in multifamily permits near a property you own signals future rent competition. You need to know that before your leases renew.
Monitor change-of-use permits in low-activity zones. Commercial permit spikes in historically quiet areas forecast residential equity gains. These are the early signals of gentrification before it becomes obvious.
Cross-reference permit clusters with local employment announcements. A new distribution center or corporate campus filing utility permits is a demand catalyst. Residential and retail permits will follow.
Avoid the single-permit trap. One large permit in a submarket is interesting. A cluster of permits across multiple owners and contractors is a conviction signal. Never act on a single data point.
The investors who use permit data well treat it as a standing intelligence operation, not a one-time research project. They check it regularly, build pattern recognition over time, and act when multiple signals converge. That discipline is what separates early movers from the crowd that shows up after prices have already moved.
Pro Tip: Cross-reference permit data with the California ADU market analysis if you operate in that state. ADU permit trends are one of the clearest leading indicators of neighborhood densification and equity growth in 2026.
Key takeaways
Permit data is the most underused public-record signal in real estate investment, and investors who build a consistent monitoring process around it gain a measurable timing advantage over the market.
PointDetailsPermit data as a leading indicatorPermit filings provide a 12–18 month look-ahead into supply, enabling early positioning before prices shift.Filter for signal qualitySet value thresholds of $100,000–$250,000 to remove maintenance noise and focus on capital projects that move markets.Cluster analysis drives convictionGeographic clusters of high-value permits across multiple owners signal institutional capital movement and upcoming equity spikes.Integrate complementary signalsCombine permit data with zoning trends, interest rate context, and NIMBY sentiment to assess execution risk accurately.Consistency beats intensityWeekly permit monitoring with saved filters outperforms occasional deep dives for identifying early-stage opportunities.
Why i think most investors are still reading permit data wrong
I have watched investors pull permit reports, see a cluster of activity, and immediately start underwriting an acquisition. That is the wrong sequence. Permit data tells you where to look, not what to buy. The investors who get burned are the ones who skip the integration step.
The fragmentation problem is real. Most permit data sits scattered across hundreds of inconsistent city portals, and the institutions that have solved this problem through automated aggregation are operating with a genuine information advantage. That gap is closing as platforms like Shovld make normalized, multi-market permit data accessible to individual investors and analysts. But the analytical discipline still has to come from you.
The future of permit data in investment analytics is not just about access. It is about scoring. The next generation of tools will not just surface permits. They will rank them by investment relevance, flag anomalies, and alert you when a submarket crosses a threshold worth acting on. Shovld is already moving in this direction with its signal intelligence approach to public-record data. The investors who build fluency with these tools now will not be playing catch-up when the market gets more competitive.
One honest warning: permit data is a leading indicator, not a guarantee. A permitted project can stall, get denied on appeal, or lose financing. Use it to identify where to focus your underwriting energy, not to replace it.
— Avi
See every permit signal before your competition does
Real estate investors who rely on scattered city portals are working with incomplete intelligence. Shovld aggregates permits, code violations, distressed-property indicators, and municipal records across multiple U.S. markets into a single, scored platform. You get early-stage signals before they become crowded opportunities.

Shovld filters out the noise and surfaces the permit clusters, change-of-use filings, and infrastructure pre-permits that actually matter for investment decisions. The platform is built for investors and analysts who want to act before the market reacts. Review the available plan tiers and see which level of market coverage fits your portfolio strategy. The timing problem in construction intelligence is solvable. Shovld is how you solve it.
FAQ
What types of permits signal the best investment opportunities?
Change-of-use permits, up-zoning approvals, and utility upgrade permits are the strongest signals. Up-zoning permits can increase land value by 20%–50%, and utility upgrades often precede rezoning announcements by six months.
How do i filter permit data to avoid noise?
Set a value threshold of $100,000–$250,000 for commercial permits. This removes minor residential maintenance records and surfaces capital projects that drive market-level changes.
Can permit data predict property value increases?
Homes within a half-mile of infrastructure-led permit clusters outperform city averages by 5%–12%. Permit clusters are a reliable leading indicator of localized equity growth when combined with zoning and demographic context.
What is the best way to access permit data across multiple markets?
API aggregation platforms like PermitStack and Shovld normalize permit records across jurisdictions at scale. PermitStack indexes over 39 million permits from 176 jurisdictions, making multi-market analysis practical without manual portal searches.
How often should investors review permit data?
Weekly monitoring with saved filters by permit type, value, and geography is the standard practice. Consistency in monitoring builds pattern recognition that occasional deep dives cannot replicate.