
How Distressed Property Clusters Signal Disaster Zones
Distressed property clusters are defined as geographically concentrated groups of properties showing simultaneous signs of financial default, physical deterioration, code violations, or deferred maintenance within a shared corridor or census tract. Real estate professionals who understand how distressed property clusters signal disaster zones gain a measurable edge over investors reacting to damage after the fact. Research applying K-Means clustering to property and hazard data shows that 42.86% of classified zones fall into the high-risk category, with only 38.1% rated low vulnerability. That distribution is not random. It reflects the same structural conditions that produce both property distress and disaster exposure in the same places.
How distressed property clusters signal disaster zones through geospatial analysis
Geospatial analysis is the primary method professionals use to connect property distress patterns to disaster risk. The core technique is K-Means clustering, an algorithm that groups properties by shared attributes such as foreclosure status, code violation density, vacancy rates, and proximity to flood plains or seismic zones. When these variables cluster spatially, the resulting map does not just show where distress exists. It shows where disaster conditions are already embedded in the built environment.
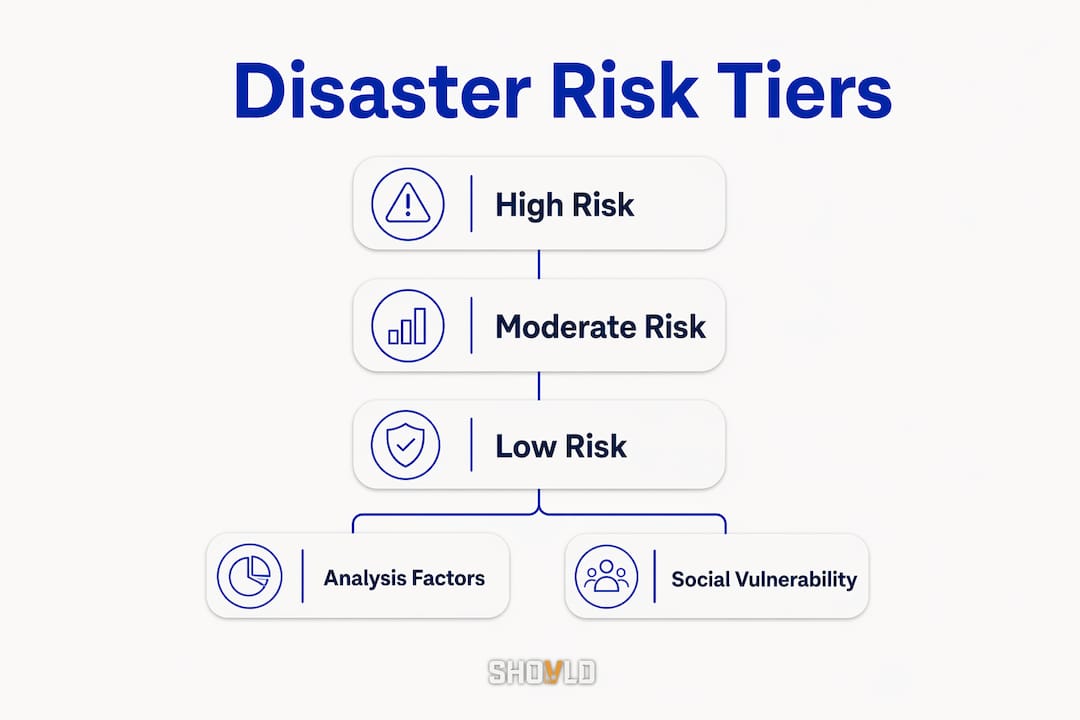
K-Means clustering applied to disaster-prone area classification produces three distinct risk tiers: high, moderate, and low vulnerability. The 42.86% high-risk share is significant because it means nearly half of all identified clusters carry compounded exposure. A single distressed property in a low-risk zone carries a different risk profile than the same property sitting inside a high-risk cluster.

The challenge in property cluster evaluations is that social vulnerability and physical hazard data rarely come from the same source. FEMA’s National Risk Index scores physical hazard exposure. The Federal Housing Finance Agency (FHFA) tracks mortgage delinquency and foreclosure rates. Geospatial analysis of urban vulnerability in Chennai found that 62.5% of wards fall into high or very high social vulnerability categories, yet traditional assessments miss this because they do not align data with actual inhabited land. The same misalignment happens in U.S. markets when investors rely on county-level averages instead of census-tract or ZIP-code level data.
GIS platforms and resilience planning tools close this gap by overlaying permit data, foreclosure filings, and hazard maps in a single view. Professionals who use property distress scoring at the parcel level can identify cluster formation before it reaches the corridor stage.
Pro Tip: When running cluster analysis, weight code violation density and permit inactivity equally with foreclosure filings. Properties with no active permits and multiple unresolved violations often precede formal foreclosure by 12 to 18 months.
Why clusters of distressed properties hit harder than isolated cases
A single distressed property creates a localized problem. A cluster of distressed properties creates a corridor effect that reshapes the entire submarket around it. The distinction matters for every valuation method a real estate professional uses.
Corridor effects in distressed clusters compound tenant demand and valuation impacts beyond what isolated distress produces. This means the income approach breaks down because comparable rents in the corridor are suppressed by vacancy contagion. The sales comparison approach fails because distressed comps dominate the pool, pulling values down for properties that are not themselves distressed.
The Cleveland East 12th and Euclid corridor illustrates this precisely. Multiple adjacent distressed properties in that corridor created a feedback loop where each new vacancy reduced foot traffic, which reduced retail viability, which accelerated further vacancy. No single property caused the collapse. The cluster did. Investors who evaluated individual properties in that corridor without accounting for the cluster dynamic consistently mispriced risk.
Key signs that a corridor effect is forming:
Three or more adjacent properties with active code violations within a two-block radius
Foreclosure filings concentrated in the same census tract over two consecutive quarters
Permit inactivity across multiple parcels while surrounding areas show normal construction activity
Tenant turnover rates rising faster in the cluster than in the surrounding ZIP code
Comparable sales volume dropping while days-on-market increases within the corridor
“Cluster distress is irreversible once established at scale, but early monitoring creates a window for intervention. The corridor effect is not inevitable. It is the result of delayed response to early signals that were visible in the data.”
Early cluster formation signals can be moderated by strategic response before full corridor distress compounds. This is the core argument for monitoring distress clusters proactively rather than reacting after the corridor has already turned.
How socioeconomic vulnerability amplifies disaster risk in distressed clusters
Physical disaster risk and borrower financial fragility are not separate problems. They interact in ways that multiply default rates and investment losses beyond what either factor produces alone.
Borrowers in high-risk zones with thin equity buffers show mortgage default rates 2–3 times higher post-disaster than borrowers with adequate equity in the same hazard zone. That multiplier effect means a cluster located in a FEMA-designated high-risk county with high loan-to-value ratios carries a fundamentally different risk profile than a cluster in the same hazard zone where borrowers hold strong equity positions.
Causal inference methods such as Double Machine Learning allow analysts to separate disaster impact from underlying socioeconomic vulnerability. This matters for underwriting because conflating the two leads to mispriced deals. An investor who attributes all default risk to the disaster event misses the borrower fragility that would have produced distress even without the disaster.
Practical underwriting considerations for distressed clusters in disaster zones:
Map the debt stack first. Liens, deferred taxes, and subordinate debt often exceed the property’s post-disaster value. Knowing the full debt structure before entering a deal prevents fatal surprises at closing.
Check foreclosure timelines. Foreclosure sale timelines dramatically alter mitigation options. A property with 37 days to sale leaves almost no room for negotiation or due diligence.
Assess equity buffers at the cluster level. A cluster where most properties carry high loan-to-value ratios signals systemic fragility, not just individual borrower problems.
Use census-tract data to score social vulnerability. FHFA delinquency data combined with Census Bureau poverty and housing cost burden metrics reveals whether distress is disaster-driven or structurally embedded.
Apply causal inference before pricing. Separating disaster-driven defaults from pre-existing borrower fragility produces a more accurate risk-adjusted return estimate.
Pro Tip: Pull FEMA National Risk Index scores alongside FHFA delinquency data for the same census tract. When both are elevated, the cluster carries compounded risk that standard cap rate analysis will not capture.
Practical strategies for analyzing distressed clusters as indicators of disaster zones
The most effective approach to distressed property analysis starts at the ZIP-code level and narrows to the census-tract level before any property-level underwriting begins. National foreclosure data shows that 0.26% of housing units carried active foreclosure filings in 2025. That national average obscures the concentration. In specific counties and property types, the rate runs multiples higher. Investors who work from national averages miss the cluster entirely.
Targeting distressed clusters regionally rather than chasing isolated properties improves investment outcomes because structural risk patterns in real estate distress are regional, not random. Leveraged entities and distressed portfolios concentrate in specific corridors for reasons tied to infrastructure age, employer base, and disaster exposure history.
A practical framework for property cluster evaluations:
Start with foreclosure filing density. Pull filings at the census-tract level for two consecutive quarters. A rising trend in a contained geography is the first cluster signal.
Overlay code violation data. Properties with multiple unresolved violations adjacent to foreclosure filings confirm cluster formation rather than isolated distress.
Score each cluster using a distress scorecard. Weight physical condition, legal encumbrances, vacancy rate, and disaster zone designation together. A single score per cluster makes comparison across markets faster.
Assess market liquidity. A cluster with low comparable sales volume and rising days-on-market signals that exit options are narrowing. Liquidity risk compounds investment risk in disaster-adjacent clusters.
Monitor early formation signals. Foreclosure activity in concentrated areas creates contractor and restoration work pipelines, but it also signals where cluster distress is forming before it becomes visible to the broader market.
Shovld tracks permits, code violations, foreclosure filings, and deferred maintenance patterns across multiple U.S. markets. Its AI-powered opportunity scoring surfaces cluster formation signals before they reach the corridor stage, giving real estate professionals and contractors a timing advantage that manual data pulls cannot match. Professionals who use distressed property data at the cluster level consistently identify disaster-adjacent risk earlier than those working from individual property records.
Key Takeaways
Distressed property clusters signal disaster zones through compounded physical, financial, and socioeconomic risk that isolated property analysis consistently misses.
PointDetailsCluster analysis beats property-level reviewK-Means clustering reveals that 42.86% of classified zones carry high disaster risk, a pattern invisible in individual property data.Corridor effects multiply valuation damageAdjacent distressed properties suppress rents and comparable sales across the entire corridor, not just at individual addresses.Borrower fragility amplifies disaster defaultsThin equity buffers in high-risk zones produce mortgage default rates 2–3 times higher post-disaster than areas with strong equity.Foreclosure data requires granular targetingThe 0.26% national foreclosure rate masks severe local concentration; census-tract analysis is the minimum useful resolution.Early monitoring creates intervention windowsCluster distress becomes irreversible at scale, but early signal detection allows professionals to act before the corridor effect locks in.
The signal most investors are still ignoring
I have watched real estate professionals spend weeks underwriting individual properties in corridors that were already in cluster distress. They ran the numbers correctly on each parcel. They still lost money. The reason is that corridor-level dynamics do not show up in a single property’s financials. They show up in the pattern across the block, the tract, and the submarket.
The uncomfortable truth about how to identify disaster areas is that the data has been available for years. FEMA publishes hazard scores. FHFA publishes delinquency rates. County recorders publish foreclosure filings. The problem is not data availability. The problem is that most professionals are still looking at one property at a time when the real signal lives in the cluster.
What I have found in markets from Cleveland to Phoenix is that the corridor effect is always visible in the data before it is visible on the street. Code violations cluster. Permit inactivity clusters. Foreclosure filings cluster. When three or more of those signals converge in the same census tract over two consecutive quarters, you are not looking at isolated distress. You are looking at a forming disaster zone. The investors who act on that pattern early are not lucky. They are reading the right level of data.
The other mistake I see constantly is conflating disaster-driven defaults with borrower fragility. These are different problems requiring different responses. Separating them with causal inference methods is not academic. It is the difference between a deal that pencils out and one that bleeds for three years.
— Avi
How Shovld helps professionals read distressed cluster signals
Real estate investors and contractors who need early visibility into distressed property clusters now have a purpose-built tool for the job. Shovld’s AI-powered signal intelligence platform aggregates permits, code violations, foreclosure filings, HOA pressure, and deferred maintenance data across U.S. markets into verified, scored opportunities.

Shovld scores each opportunity before the market reacts, so professionals can act on cluster formation signals rather than corridor-stage damage. The platform’s workflow automation and CRM integrations mean that tracking dozens of clusters across multiple markets does not require a full research team. For professionals ready to move from reactive to proactive, Shovld’s pricing plans are built to scale with the size of your market coverage.
FAQ
What are distressed property clusters?
Distressed property clusters are geographically concentrated groups of properties showing simultaneous signs of financial default, physical deterioration, or code violations within a shared corridor or census tract. They differ from isolated distressed properties because their compound effects reshape local market conditions.
How do distressed clusters indicate disaster zones?
Clusters of distressed properties correlate with disaster zones because the same conditions that produce physical hazard exposure, such as aging infrastructure and socioeconomic fragility, also drive property distress. K-Means clustering research shows 42.86% of classified zones carry high disaster risk.
What is the corridor effect in distressed property analysis?
The corridor effect describes how multiple adjacent distressed properties suppress tenant demand and comparable sales values across an entire block or submarket, not just at individual addresses. This makes standard income and sales comparison valuation methods unreliable within the affected corridor.
How does borrower fragility interact with disaster risk in clusters?
Borrowers in high-risk zones with thin equity buffers show mortgage default rates 2–3 times higher post-disaster than those with strong equity in the same hazard zone. This means physical disaster risk and financial fragility must be assessed together, not separately.
What data sources are most useful for identifying disaster-adjacent distressed clusters?
FEMA’s National Risk Index, FHFA delinquency data, county foreclosure filings, and municipal code violation records are the four most useful sources. Analyzing them together at the census-tract level reveals cluster formation signals that county-level or national averages consistently hide.